Compare South Carolina Car Insurance Rates [2026]
South Carolina car insurance requirements are 25/50/50 for bodily injury and property damage coverage. A 35-year-old married female will pay $162 a month on average. Who has the most reasonable insurance rates? State Farm. Learn how to compare South Carolina car insurance rates to get the best deal.
Read more![]() Secured with SHA-256 Encryption
Secured with SHA-256 Encryption


Table of Contents
Table of Contents

Feature Writer
Chris Tepedino is a feature writer that has written extensively about car insurance for numerous websites. He has a college degree in communication from the University of Tennessee and has experience reporting, researching investigative pieces, and crafting detailed, data-driven features. His works have been featured on CB Blog Nation, Healing Law, WIBW Kansas, and Cinncinati.com. He has been a...
Chris Tepedino

Insurance Operations Specialist
Michael earned a degree in Business Management degree with an insurance focus, which led to a successful 25-year career in insurance claims operations and support. He possesses a high-level of business acumen across multiple areas of the insurance industry. Over the course of his career, he served in multiple roles supporting claims operations including: Claims Specialist, Claims Trainer, Claim Au...
Michael Leotta
Updated May 2024
| South Carolina Statistics Summary | Details |
|---|---|
| Road Miles | Total in State: 76,301 Vehicle Miles Driven: 49,931 billion |
| Vehicles | Registered: 3,902,945 Total Stolen: 12,902 |
| State Population | 39,557,045 |
| Most Popular Vehicle | Ford F-150 |
| Motorists Uninsured | 9.4% State Rank: 37th |
| Driving Deaths | 2013-2017 Speeding: 1787 Drunk Driving: 1630 |
| Annual Premiums | Liability: $527 Collision: $265 Comprehensive: $180 Combined Premium: $973 |
| Cheapest Provider | State Farm |
Known for its beautiful beaches, miles of shoreline, historical cities, and some of the best vacation spots in America, South Carolina is certainly a great place to go on a honeymoon, start a family, and even retire. But if you’re driving all that gorgeous shoreline, one thing is for sure: it is imperative to have car insurance. Trying to find the best car insurance in SC is difficult — especially when there are so many options available these days.
How do you know what car insurance company is best suited for you? What kind of car insurance do you need? With this comprehensive guide, you will learn everything there is to know about choosing the right type of car insurance and which car insurance company to buy from.
In this guide, we cover types of insurance coverage, state laws, providers, and more. To compare South Carolina car insurance rates today, use our FREE online tool above.
South Carolina Car Insurance Coverage and Rates
If you’re having a hard time understanding the different plans and types of car insurance, don’t feel overwhelmed! You’ve come to the right place.
We want you to understand exactly what your plan covers (and what it doesn’t cover). After all, you are paying for it, right?
Hold on tight and keep reading to learn all about South Carolina insurance companies, major insurance types, and rates in South Carolina and in the surrounding states.
South Carolina Minimum Coverage
When you apply for a driver’s license (or renew your license) in the state of South Carolina, you must state either that you are an insured driver, or that you do not own a vehicle. What is no-fault car insurance and how does it work? This type of insurance helps pay for the costs of a car accident no matter who is at fault.
Because South Carolina is an at-fault state, state residents are required to carry liability auto insurance that meets at least the following minimums:
- Car Insurance Rates in South Carolina
- Compare Wallace, SC Car Insurance Rates [2026]
- Compare Santee, SC Car Insurance Rates [2026]
- Compare Pickens, SC Car Insurance Rates [2026]
- Compare Hollywood, SC Car Insurance Rates [2026]
- Compare Florence, SC Car Insurance Rates [2026]
- Compare Charleston, SC Car Insurance Rates [2026]
- Compare Bluffton, SC Car Insurance Rates [2026]
- Compare Anderson, SC Car Insurance Rates [2026]
- $25,000 for bodily injury or death per person in an accident caused by the owner/driver of the insured vehicle
- $50,000 for total bodily injury or death liability per accident caused by the owner/driver of the insured vehicle
- $25,000 for property damage per accident caused by the owner/driver of the insured vehicle.
But what does liability coverage mean and what does it cover?
Simply put, you are liable or at fault for any damages that occur because of an accident you caused.
These damages include covering the costs of medical bills to anyone who is injured because of the accident, as well as covering the costs of vehicle damages and property damages. If the cost of the damages incurred from the accident is higher than what your insurance covers, you are required to pay for the rest of these damages.
Keep in mind that minimum liability car insurance does not cover anything that happens to you or your vehicle at the time of the accident if it was caused by you or the person driving your car.
Who is covered by minimum liability insurance?
- A family member or friend that is driving your car at the time of the accident
- Any person who was given permission to drive your car at the time of the accident
- It is likely to cover you if you are driving a rental car at the time of the accident. Compare rental car insurance to get better rates.
Minimum coverage is the cheapest option when it comes to car insurance, but it is not the same across the nation. Take a look.
Just remember if you’re worried about being held responsible for more than the minimum liability coverage, it might be a good idea to purchase a plan with better insurance.
Forms of Financial Responsibility
Proof of insurance proves financial responsibility, and by law, South Carolina drivers must be able to prove financial responsibility at all times. Vehicle owners must maintain proof of insurance at all times and must give a copy to any law enforcement officer demanding to see it.
Acceptable forms of proof of insurance are:
- Liability Insurance ID Card
- Valid Binder (temporary form of insurance card)
- Copy of the car’s current insurance policy
If you’re pulled over and caught without proof of insurance on a car you don’t own and you are given a ticket, you must provide proof of insurance within 30 days. If you cannot show proof within 30 days, you may need to pay a $100 reinstatement fee.
If you received a ticket for not having insurance on a car you do own, your license and registration will be suspended until the South Carolina DMV receives a $550 uninsured motorist fee and you must prove that you will have insurance for the next three years.
Verifying Your Insurance
The South Carolina DMV will verify your insurance when you register or renew the tags on your vehicle. If your policy is not valid or cannot be found, your license and registration will be suspended and you may need to pay a $400 fee to reinstate your driving privileges.
Don’t want to lose your license and have to pay fees left and right? Make sure you keep your proof of insurance on your person and in your vehicle at all times.
But wait! There’s more! Sit tight for more info about car insurance premiums in South Carolina.
Premiums as a Percentage of Income
South Carolina’s average disposable per capita annual income is $33,295. Per capita income is the amount of money a person has after paying taxes.
If $33,295 is the average annual per capita, this means that the average monthly amount of income is $2772.58.
The yearly average amount that residents pay for car insurance in South Carolina is $936.69. That means they are paying a monthly rate of $78.06!
The average rate (or amount) for car insurance in America is $974.26, so South Carolina rates are roughly $40 lower than the average. Of course, if you add more coverage to your insurance plan, your rates are sure to go up in price. It’s good to compare South Carolina’s rates to the states with the highest car insurance rates.
What is the average cost of auto insurance in SC? Below is a table showing South Carolina’s average car insurance rates by type: liability, collision, comprehensive, and combined.
Average Monthly Car Insurance Rates in SC (Liability, Collision, Comprehensive)
South Carolina Coverage Types and Average Monthly Rates
| Coverage Type | Rates |
|---|---|
| Liability | $44 |
| Collision | $22 |
| Comprehensive | $15 |
| Combined | $81 |
The data above is reliably sourced from the National Association of Insurance Commissioners.
Remember, this data was pulled from 2015, and rates may be higher for 2019.
Sometimes it’s best to have additional insurance on top of the required insurance for your state in case of a bad accident.
Where you live also affects your rates, especially from state to state.
Still have no idea what you’re doing? Don’t worry! Next, we will help you understand some additional coverage types, and why they are important. Be aware that these types can be added to any basic car insurance plan.
Additional Liability Coverage
| Loss Ratio | 2014 | 2013 | 2012 |
|---|---|---|---|
| Medical Payments (MedPay) | 84.33% | 90.12% | 88.86% |
| Unisured/Underinsured Motorist Coverage (UUM) | 73.79% | 72.37% | 69.29% |
The table above shows that in 2014, about 84 percent of medical bill claims were covered by the person’s insurance company and almost 74 percent of uninsured/underinsured claims were also covered.
This is called a loss ratio. Car insurance companies who aren’t covering enough claims may be scamming you out of paying too much towards your yearly premium rate. But, companies who are covering too many claims, run the risk of bankrupting themselves. That being said, car insurance companies who pay about 60-85 percent of claims are good companies to invest in when it comes to making sure your claim will be covered appropriately.
The table above shows that South Carolina has good rates for claims being covered.
For example:
If you are paying $1,200 a year towards your premium, about 84 percent of that money is going towards covering claims — whether you or someone else with your car insurance company has been in an accident.
Although these types of additional liability coverage plans are not required in the state of South Carolina, you might decide that adding some extra padding to your plan is a good idea.
Approximately 9.4 percent of motorists in South Carolina are uninsured. South Carolina is ranked 37th in the state for uninsured drivers!
But what does this frightening fact mean for you? Almost 10 percent of drivers will not be able to pay for damages in accidents that they cause! Most of these accidents caused by uninsured drivers will cause the driver to go bankrupt, leaving you vulnerable to covering the costs of damages yourself.
Also, be sure to find a company that doesn’t have super high (over 90 percent) or super low (under 60 percent) loss ratios. Read about how to calculate total loss for car insurance for more information on this topic.
Add-Ons, Endorsements, and Riders
We’ve already made it crystal clear that having just the required amount of car insurance isn’t always the smartest idea. But are there any other factors to consider? How do you know what other scenarios your plan should cover?
Below is a list of some of the most cost-effective insurance coverage out there.
Pay attention! This list is extremely important and will help you save money when an accident occurs.
- Guaranteed Auto Protection (GAP)
- Personal Umbrella Policy (PUP)
- Rental Reimbursement
- Emergency Road Assistance
- Mechanical Breakdown Insurance
- Non-Owner Car Insurance
- Modified Car Insurance Coverage
- Classic Car Insurance
- Low-Mileage Discount
- Pay-as-you-go Car Insurance
Just like with additional liability coverage, these add-on car insurance coverage options can be added separately to your existing policy, or all at once, giving you the option to customize your plan.
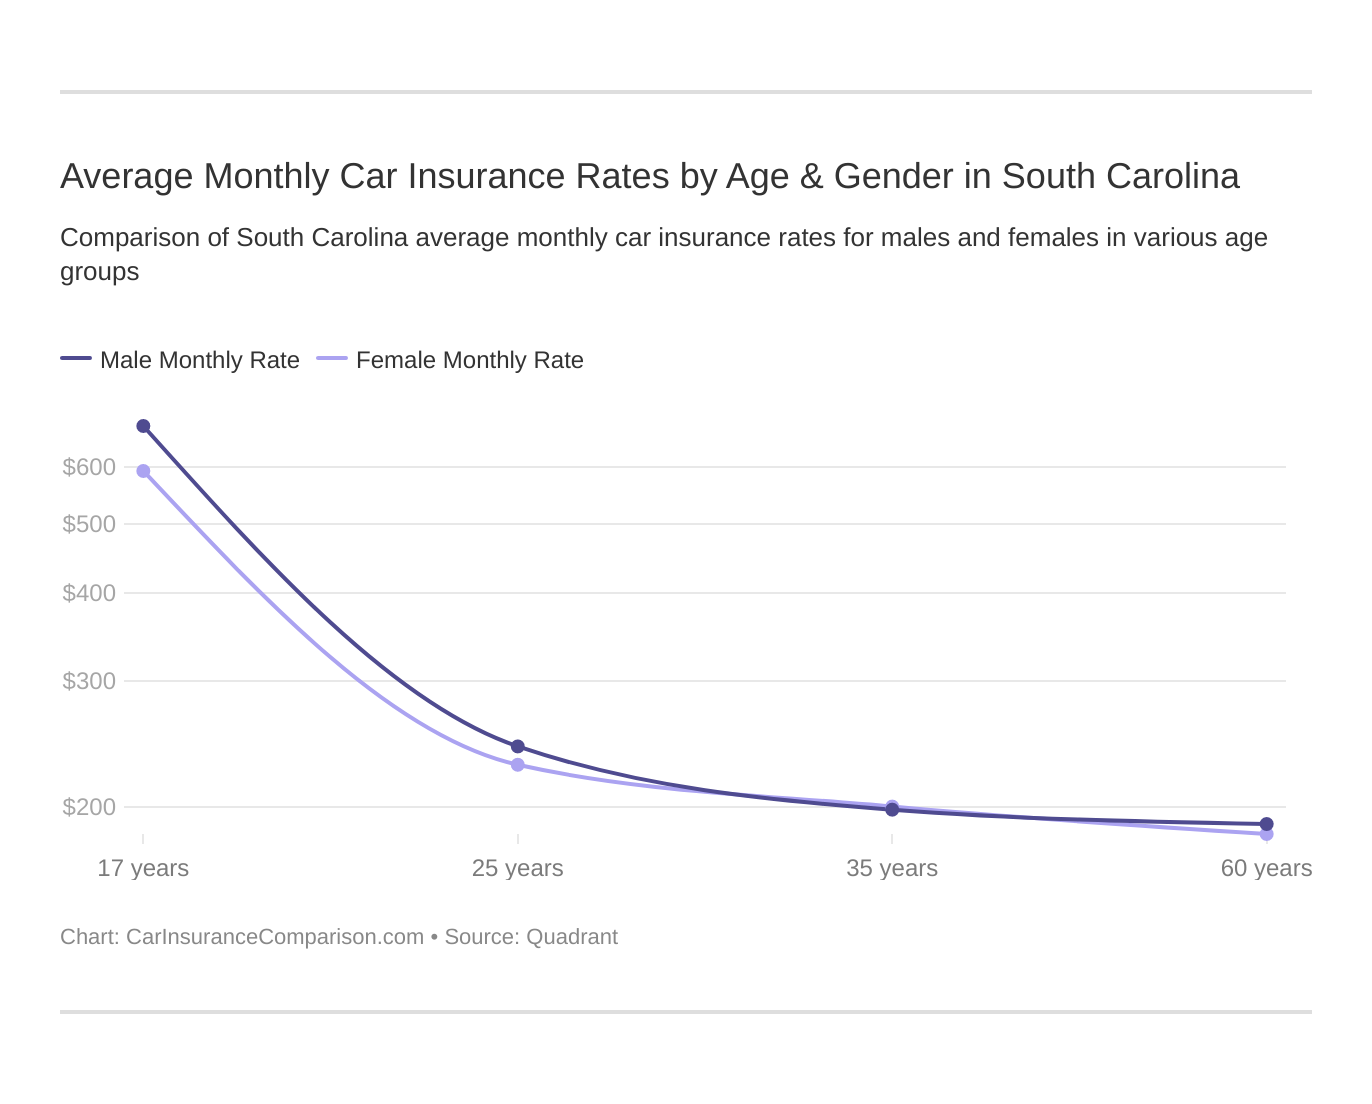
Average Monthly Car Insurance Rates by Age & Gender in SC
Did you know that things like your age, gender, what you do for work, and if you’re married or single can influence your car insurance rate?
The proof is in the pudding below!
| Company | Married 35-year old female Annual Rate | Married 35-year old male Annual Rate | Married 60-year old female Annual Rate | Married 60-year old male Annual Rate | Single 17-year old female Annual Rate | Single 17-year old male Annual Rate | Single 25-year old female Annual Rate | Single 25-year old male Annual Rate |
|---|---|---|---|---|---|---|---|---|
| Allstate F&C | $2,575.42 | $2,575.42 | $2,462.77 | $2,462.77 | $6,662.45 | $8,518.45 | $2,858.85 | $3,111.28 |
| Bristol West Select | $3,198.86 | $3,212.56 | $3,054.08 | $3,319.19 | $8,424.07 | $9,324.42 | $3,486.65 | $3,514.99 |
| Geico Govt Employees | $2,292.59 | $2,292.59 | $2,092.47 | $2,092.47 | $5,552.76 | $5,685.15 | $2,674.55 | $2,741.48 |
| Nationwide Mutual Fire | $2,469.20 | $2,501.59 | $2,223.66 | $2,308.30 | $5,970.02 | $7,692.64 | $2,792.80 | $3,045.71 |
| Progressive Northern | $2,477.19 | $2,286.14 | $2,128.88 | $2,225.14 | $10,287.93 | $11,361.20 | $2,848.88 | $2,969.28 |
| State Farm Mutual Auto | $1,938.66 | $1,938.66 | $1,755.90 | $1,755.90 | $5,564.16 | $6,994.35 | $2,175.82 | $2,447.27 |
| USAA | $1,836.27 | $1,842.82 | $1,688.20 | $1,690.25 | $7,341.34 | $8,041.03 | $2,414.03 | $2,544.18 |
As you can see, the younger you are, the higher the rate you’ll pay.
Males are often associated with being reckless drivers, so more than likely they will pay more for car insurance than females do.
Highest and Lowest Insurance Rates by ZIP Codes
If you live in a big city, your rate might be higher than someone who lives in the country, or vice versa. See if you can find your ZIP code in the chart or lists below.
| Cheapest ZIP Codes in South Carolina | City | Average Annual Rate by ZIP Codes | Most Expensive Company | Most Expensive Annual Rate | 2nd Most Expensive Company | 2nd Most Expensive Annual Rate | Cheapest Company | Cheapest Annual Rate | 2nd Cheapest Company | 2nd Cheapest Annual Rate |
|---|---|---|---|---|---|---|---|---|---|---|
| 29672 | SENECA | $3,115.58 | Progressive | $3,579.43 | Allstate | $3,415.04 | Geico | $2,565.72 | State Farm | $2,833.51 |
| 29630 | CENTRAL | $3,145.58 | Progressive | $3,566.99 | Allstate | $3,516.93 | Geico | $2,565.72 | State Farm | $2,737.87 |
| 29665 | NEWRY | $3,149.62 | Progressive | $3,579.43 | Allstate | $3,415.04 | Geico | $2,565.72 | State Farm | $2,772.98 |
| 29675 | RICHLAND | $3,155.03 | Progressive | $3,579.43 | Allstate | $3,415.04 | Geico | $2,565.72 | State Farm | $2,772.98 |
| 29691 | WALHALLA | $3,166.58 | Progressive | $3,790.86 | Farmers | $3,508.45 | Geico | $2,565.72 | State Farm | $2,734.29 |
| 29631 | CLEMSON | $3,197.43 | Progressive | $3,861.76 | Farmers | $3,710.66 | Geico | $2,565.72 | State Farm | $2,699.23 |
| 29676 | SALEM | $3,206.09 | Progressive | $3,940.77 | Farmers | $3,623.51 | Geico | $2,565.72 | State Farm | $2,689.60 |
| 29696 | WEST UNION | $3,217.19 | Progressive | $3,969.16 | Farmers | $3,667.62 | Geico | $2,565.72 | State Farm | $2,751.09 |
| 29384 | WATERLOO | $3,225.08 | Progressive | $3,703.61 | Allstate | $3,577.44 | Geico | $2,694.51 | State Farm | $2,713.91 |
| 29678 | SENECA | $3,243.62 | Progressive | $3,919.60 | Farmers | $3,671.68 | Geico | $2,565.72 | State Farm | $2,787.44 |
| 29664 | MOUNTAIN REST | $3,249.79 | Progressive | $4,144.41 | Farmers | $3,766.09 | Geico | $2,565.72 | State Farm | $2,665.68 |
| 29649 | GREENWOOD | $3,265.18 | Allstate | $3,608.76 | Farmers | $3,540.15 | Geico | $2,694.51 | State Farm | $3,058.20 |
| 29360 | LAURENS | $3,274.83 | Progressive | $3,742.80 | Allstate | $3,577.44 | Geico | $2,694.51 | State Farm | $2,933.08 |
| 29686 | TAMASSEE | $3,281.99 | Progressive | $4,231.99 | Farmers | $3,820.09 | Geico | $2,565.72 | State Farm | $2,772.98 |
| 29693 | WESTMINSTER | $3,282.69 | Progressive | $4,249.81 | Farmers | $3,775.24 | Geico | $2,565.72 | State Farm | $2,710.30 |
| 29653 | HODGES | $3,282.69 | Progressive | $3,703.61 | Allstate | $3,577.44 | State Farm | $2,801.83 | Geico | $2,932.61 |
| 29634 | CLEMSON | $3,284.03 | Progressive | $4,245.12 | Farmers | $3,924.92 | Geico | $2,565.72 | State Farm | $2,605.92 |
| 29632 | CLEMSON | $3,293.34 | Progressive | $4,245.12 | Farmers | $3,924.92 | Geico | $2,565.72 | State Farm | $2,772.98 |
| 29685 | SUNSET | $3,297.56 | Progressive | $4,227.89 | Farmers | $3,930.35 | Geico | $2,565.72 | State Farm | $2,735.92 |
| 29689 | TOWNVILLE | $3,300.96 | Progressive | $4,137.45 | Farmers | $3,805.52 | Geico | $2,565.72 | State Farm | $2,803.61 |
| 29332 | CROSS HILL | $3,305.73 | Progressive | $3,807.26 | Allstate | $3,695.94 | State Farm | $2,745.30 | Geico | $2,761.75 |
| 29645 | GRAY COURT | $3,306.89 | Progressive | $3,824.81 | Allstate | $3,694.75 | Geico | $2,717.44 | State Farm | $2,949.06 |
| 29670 | PENDLETON | $3,307.03 | Progressive | $4,074.82 | Farmers | $3,925.33 | Geico | $2,565.72 | State Farm | $2,712.82 |
| 29646 | GREENWOOD | $3,307.52 | Progressive | $3,652.20 | Allstate | $3,608.76 | Geico | $2,694.51 | USAA | $3,091.57 |
| 29370 | MOUNTVILLE | $3,320.32 | Progressive | $3,903.48 | Farmers | $3,687.20 | Geico | $2,761.75 | State Farm | $2,773.66 |
Seneca has the cheapest ZIP code in South Carolina.
| Most Expensive ZIP Codes in South Carolina | City | Average Annual Rate by ZIP Code | Most Expensive Company | Most Expensive Annual Rate | 2nd Most Expensive Company | 2nd Most Expensive Annual Rate | Cheapest Company | Cheapest Annual Rate | 2nd Cheapest Company | 2nd Cheapest Annual Rate |
|---|---|---|---|---|---|---|---|---|---|---|
| 29933 | MILEY | $4,519.05 | Farmers | $6,522.32 | Progressive | $5,092.35 | State Farm | $3,329.79 | USAA | $3,939.94 |
| 29810 | ALLENDALE | $4,504.34 | Progressive | $5,893.85 | Farmers | $5,603.79 | State Farm | $3,343.86 | USAA | $3,939.94 |
| 29918 | ESTILL | $4,499.47 | Farmers | $5,824.91 | Progressive | $5,611.39 | State Farm | $3,371.09 | USAA | $3,939.94 |
| 29939 | SCOTIA | $4,493.57 | Farmers | $5,824.91 | Progressive | $5,611.39 | State Farm | $3,329.79 | USAA | $3,939.94 |
| 29913 | CROCKETVILLE | $4,449.78 | Farmers | $6,522.32 | Progressive | $4,607.45 | State Farm | $3,329.79 | USAA | $3,939.94 |
| 29433 | CANADYS | $4,434.52 | Farmers | $6,522.32 | Progressive | $4,731.33 | State Farm | $3,329.79 | Geico | $3,780.89 |
| 29827 | FAIRFAX | $4,412.90 | Progressive | $5,607.56 | Farmers | $5,282.19 | State Farm | $3,311.69 | USAA | $3,939.94 |
| 29921 | FURMAN | $4,405.94 | Farmers | $6,522.32 | Geico | $4,320.69 | State Farm | $3,354.61 | USAA | $3,939.94 |
| 29934 | PINELAND | $4,396.05 | Farmers | $5,601.37 | Progressive | $5,227.88 | State Farm | $3,343.22 | USAA | $3,939.94 |
| 29944 | VARNVILLE | $4,386.30 | Progressive | $5,694.00 | Farmers | $5,669.24 | State Farm | $3,295.29 | Geico | $3,677.41 |
| 29481 | SMOAKS | $4,369.12 | Farmers | $5,486.93 | Progressive | $5,358.73 | State Farm | $3,358.76 | Geico | $3,707.18 |
| 29911 | BRUNSON | $4,363.46 | Farmers | $5,367.87 | Progressive | $5,223.76 | State Farm | $3,263.75 | USAA | $3,939.94 |
| 29923 | GIFFORD | $4,338.69 | Farmers | $5,259.85 | Progressive | $5,092.35 | State Farm | $3,329.79 | USAA | $3,939.94 |
| 29932 | LURAY | $4,338.69 | Farmers | $5,259.85 | Progressive | $5,092.35 | State Farm | $3,329.79 | USAA | $3,939.94 |
| 29924 | HAMPTON | $4,333.58 | Farmers | $5,178.39 | Progressive | $5,172.50 | State Farm | $3,295.29 | USAA | $3,939.94 |
| 29916 | EARLY BRANCH | $4,295.75 | Farmers | $5,139.84 | Progressive | $4,917.16 | State Farm | $3,324.36 | USAA | $3,939.94 |
| 29486 | SUMMERVILLE | $4,291.55 | Progressive | $6,330.20 | Farmers | $4,486.60 | State Farm | $3,335.97 | Geico | $3,363.86 |
| 29922 | GARNETT | $4,252.93 | Farmers | $4,952.29 | Progressive | $4,743.26 | State Farm | $3,386.08 | USAA | $3,939.94 |
| 29046 | ELLIOTT | $4,248.92 | Farmers | $5,797.64 | Progressive | $4,870.51 | State Farm | $3,320.82 | Geico | $3,779.59 |
| 29430 | BETHERA | $4,239.55 | Farmers | $6,542.72 | Nationwide | $4,364.41 | State Farm | $3,335.97 | Geico | $3,395.57 |
| 29104 | MAYESVILLE | $4,229.63 | Farmers | $5,718.85 | Progressive | $4,931.71 | State Farm | $3,203.35 | Geico | $3,779.59 |
| 29836 | MARTIN | $4,215.45 | Progressive | $5,303.60 | Farmers | $5,186.48 | State Farm | $3,329.79 | Geico | $3,707.18 |
| 29450 | HUGER | $4,214.87 | Farmers | $5,333.72 | Progressive | $5,068.38 | State Farm | $3,228.14 | Geico | $3,512.70 |
| 29476 | RUSSELLVILLE | $4,179.21 | Progressive | $5,051.12 | Farmers | $5,030.80 | State Farm | $3,335.97 | Geico | $3,512.70 |
| 29468 | PINEVILLE | $4,174.40 | Farmers | $5,236.46 | Progressive | $5,172.71 | State Farm | $3,091.77 | Geico | $3,395.57 |
Highest and Lowest Insurance Rates by Cities
The lists below compare car insurance rates based on cities with the highest rates versus cities with the lowest rates.
| Cheapest Cities in South Carolina | Average Annual Rate by City | Most Expensive Company | Most Expensive Annual Rate | 2nd Most Expensive Company | 2nd Most Expensive Annual Rate | Cheapest Company | Cheapest Annual Rate | 2nd Cheapest Company | 2nd Cheapest Annual Rate |
|---|---|---|---|---|---|---|---|---|---|
| Central | $3,145.58 | Progressive | $3,566.99 | Allstate | $3,516.93 | Geico | $2,565.72 | State Farm | $2,737.87 |
| Newry | $3,149.62 | Progressive | $3,579.43 | Allstate | $3,415.04 | Geico | $2,565.72 | State Farm | $2,772.98 |
| Richland | $3,155.03 | Progressive | $3,579.43 | Allstate | $3,415.04 | Geico | $2,565.72 | State Farm | $2,772.98 |
| Walhalla | $3,166.58 | Progressive | $3,790.86 | Farmers | $3,508.45 | Geico | $2,565.72 | State Farm | $2,734.29 |
| Seneca | $3,179.60 | Progressive | $3,749.52 | Farmers | $3,519.99 | Geico | $2,565.72 | State Farm | $2,810.48 |
| Salem | $3,206.09 | Progressive | $3,940.77 | Farmers | $3,623.51 | Geico | $2,565.72 | State Farm | $2,689.60 |
| West Union | $3,217.19 | Progressive | $3,969.16 | Farmers | $3,667.62 | Geico | $2,565.72 | State Farm | $2,751.09 |
| Waterloo | $3,225.08 | Progressive | $3,703.61 | Allstate | $3,577.44 | Geico | $2,694.51 | State Farm | $2,713.91 |
| Mountain Rest | $3,249.79 | Progressive | $4,144.41 | Farmers | $3,766.09 | Geico | $2,565.72 | State Farm | $2,665.68 |
| Clemson | $3,258.27 | Progressive | $4,117.33 | Farmers | $3,853.50 | Geico | $2,565.72 | State Farm | $2,692.71 |
| Laurens | $3,274.83 | Progressive | $3,742.80 | Allstate | $3,577.44 | Geico | $2,694.51 | State Farm | $2,933.08 |
| Tamassee | $3,281.99 | Progressive | $4,231.99 | Farmers | $3,820.09 | Geico | $2,565.72 | State Farm | $2,772.98 |
| Westminster | $3,282.69 | Progressive | $4,249.81 | Farmers | $3,775.24 | Geico | $2,565.72 | State Farm | $2,710.30 |
| Hodges | $3,282.69 | Progressive | $3,703.61 | Allstate | $3,577.44 | State Farm | $2,801.83 | Geico | $2,932.61 |
| Greenwood | $3,286.35 | Allstate | $3,608.76 | Progressive | $3,576.34 | Geico | $2,694.51 | USAA | $3,091.57 |
| Sunset | $3,297.56 | Progressive | $4,227.89 | Farmers | $3,930.35 | Geico | $2,565.72 | State Farm | $2,735.92 |
| Townville | $3,300.97 | Progressive | $4,137.45 | Farmers | $3,805.52 | Geico | $2,565.72 | State Farm | $2,803.61 |
| Cross Hill | $3,305.73 | Progressive | $3,807.26 | Allstate | $3,695.94 | State Farm | $2,745.30 | Geico | $2,761.75 |
| Gray Court | $3,306.89 | Progressive | $3,824.81 | Allstate | $3,694.75 | Geico | $2,717.44 | State Farm | $2,949.06 |
| Pendleton | $3,307.03 | Progressive | $4,074.82 | Farmers | $3,925.33 | Geico | $2,565.72 | State Farm | $2,712.82 |
| Mountville | $3,320.32 | Progressive | $3,903.48 | Farmers | $3,687.20 | Geico | $2,761.75 | State Farm | $2,773.66 |
| Fair Play | $3,323.71 | Progressive | $4,266.56 | Farmers | $3,859.49 | Geico | $2,565.72 | State Farm | $2,787.44 |
| Long Creek | $3,333.92 | Progressive | $4,274.73 | Farmers | $3,941.61 | Geico | $2,565.72 | State Farm | $2,772.98 |
| Mount Carmel | $3,352.98 | Progressive | $3,839.66 | Allstate | $3,735.83 | State Farm | $2,776.13 | Geico | $2,932.61 |
| Simpsonville | $3,354.24 | Farmers | $3,826.74 | Allstate | $3,759.62 | Geico | $2,717.44 | USAA | $2,969.43 |
Is car insurance more expensive in SC? The next list shows which cities have the most expensive rates for car insurance.
| Most Expensive Cities in South Carolina | Average Annual Rate by City | Most Expensive Company | Most Expensive Annual Rate | 2nd Most Expensive Company | 2nd Most Expensive Annual Rate | Cheapest Company | Cheapest Annual Rate | 2nd Cheapest Company | 2nd Cheapest Annual Rate |
|---|---|---|---|---|---|---|---|---|---|
| Miley | $4,519.05 | Farmers | $6,522.32 | Progressive | $5,092.35 | State Farm | $3,329.79 | USAA | $3,939.94 |
| Allendale | $4,504.34 | Progressive | $5,893.85 | Farmers | $5,603.79 | State Farm | $3,343.86 | USAA | $3,939.94 |
| Estill | $4,499.47 | Farmers | $5,824.91 | Progressive | $5,611.39 | State Farm | $3,371.09 | USAA | $3,939.94 |
| Scotia | $4,493.57 | Farmers | $5,824.91 | Progressive | $5,611.39 | State Farm | $3,329.79 | USAA | $3,939.94 |
| Crocketville | $4,449.78 | Farmers | $6,522.32 | Progressive | $4,607.45 | State Farm | $3,329.79 | USAA | $3,939.94 |
| Canadys | $4,434.52 | Farmers | $6,522.32 | Progressive | $4,731.33 | State Farm | $3,329.79 | Geico | $3,780.89 |
| Fairfax | $4,412.90 | Progressive | $5,607.56 | Farmers | $5,282.19 | State Farm | $3,311.69 | USAA | $3,939.94 |
| Furman | $4,405.94 | Farmers | $6,522.32 | Geico | $4,320.69 | State Farm | $3,354.61 | USAA | $3,939.94 |
| Pineland | $4,396.05 | Farmers | $5,601.37 | Progressive | $5,227.88 | State Farm | $3,343.22 | USAA | $3,939.94 |
| Varnville | $4,386.30 | Progressive | $5,694.00 | Farmers | $5,669.24 | State Farm | $3,295.29 | Geico | $3,677.41 |
| Smoaks | $4,369.12 | Farmers | $5,486.93 | Progressive | $5,358.73 | State Farm | $3,358.76 | Geico | $3,707.18 |
| Brunson | $4,363.46 | Farmers | $5,367.87 | Progressive | $5,223.76 | State Farm | $3,263.75 | USAA | $3,939.94 |
| Gifford | $4,338.69 | Farmers | $5,259.85 | Progressive | $5,092.35 | State Farm | $3,329.79 | USAA | $3,939.94 |
| Luray | $4,338.69 | Farmers | $5,259.85 | Progressive | $5,092.35 | State Farm | $3,329.79 | USAA | $3,939.94 |
| Hampton | $4,333.58 | Farmers | $5,178.39 | Progressive | $5,172.50 | State Farm | $3,295.29 | USAA | $3,939.94 |
| Early Branch | $4,295.75 | Farmers | $5,139.84 | Progressive | $4,917.16 | State Farm | $3,324.36 | USAA | $3,939.94 |
| Summerville | $4,291.55 | Progressive | $6,330.20 | Farmers | $4,486.60 | State Farm | $3,335.97 | Geico | $3,363.86 |
| Garnett | $4,252.93 | Farmers | $4,952.29 | Progressive | $4,743.26 | State Farm | $3,386.08 | USAA | $3,939.94 |
| Elliott | $4,248.92 | Farmers | $5,797.64 | Progressive | $4,870.51 | State Farm | $3,320.82 | Geico | $3,779.59 |
| Bethera | $4,239.55 | Farmers | $6,542.72 | Nationwide | $4,364.41 | State Farm | $3,335.97 | Geico | $3,395.57 |
| Mayesville | $4,229.62 | Farmers | $5,718.85 | Progressive | $4,931.71 | State Farm | $3,203.35 | Geico | $3,779.59 |
| Martin | $4,215.45 | Progressive | $5,303.60 | Farmers | $5,186.48 | State Farm | $3,329.79 | Geico | $3,707.18 |
| Huger | $4,214.87 | Farmers | $5,333.72 | Progressive | $5,068.38 | State Farm | $3,228.14 | Geico | $3,512.70 |
| Russellville | $4,179.20 | Progressive | $5,051.12 | Farmers | $5,030.80 | State Farm | $3,335.97 | Geico | $3,512.70 |
| Pineville | $4,174.40 | Farmers | $5,236.46 | Progressive | $5,172.71 | State Farm | $3,091.77 | Geico | $3,395.57 |
Free Insurance Comparison
Compare Quotes From Top Companies and Save
![]() Secured with SHA-256 Encryption
Secured with SHA-256 Encryption
Best South Carolina Car Insurance Companies
Now that we’ve touched on different types of car insurance, it’s time to start discussing how to find a good car insurance company, and why and how that company will meet your needs in the long run.
But sometimes it’s a full-time job just to research all of the different car insurance companies out there, and that’s exactly why we took some of the guesswork out of it for you.
Picking one of the largest companies can be a good choice. Take a look at some of the dominant ones in South Carolina below. This will help you find the best car insurance companies in your area.
Stay tuned as we hit company ratings, complaints, and more.
The Largest Companies’ Financial Ratings
What is an AM Best Rating?
According to Insure.com, an AM Best Rating is an independent opinion based on a company’s financial strength and ability to meet its ongoing insurance policy and contract obligations.
Here is a complete table of financial ratings for some of the largest companies in the state of South Carolina.
| Company Name | Rating | Written | Ratio | Share |
|---|---|---|---|---|
| State Farm Group | A++ | $949,692 | 70.89% | 23.88% |
| Geico | A++ | $523,217 | 73.02% | 13.16% |
| Allstate Insurance Group | A+ | $473,094 | 58.46% | 11.90% |
| USAA Group | A++ | $365,476 | 92.18% | 9.19% |
| Progressive Group | A+ | $340,855 | 61.82% | 8.57% |
| Nationwide Corp Group | A+ | $283,086 | 62.32% | 7.12% |
| Liberty Mutual Group | A | $206,434 | 69.57% | 5.19% |
| Travelers Group | NR | $176,219 | 70.63% | 4.43% |
| Southern Farm Bureau Casualty Group | A+ | $134,639 | 81.21% | 3.39% |
| Auto-Owners Group | A++ | $68,469 | 74.46% | 1.72% |
| State Total | $3,976,597 | 70.62% | 100.00% |
As you can see, all of these companies have a pretty good loss ratio. USSA Group is slightly high at 92.18 percent, but overall, none of these companies are at risk of going bankrupt.
Companies with the Most Complaints in South Carolina
Take a good look at the data below.
This is a list showing company complaints versus total complaints against the top ten car insurance companies in South Carolina. Remember that there can be invalid complaints. It does not mean a company is a bad company just because it may receive complaints every once in a while.
| Top Providers of Car Insurance in South Carolina | Company Complaint Ratio in 2017 | Total Complaints 2017 |
|---|---|---|
| State Farm Group | 0.44 | 1482 |
| Geico | 0.007 | 6 |
| Allstate Insurance Group | 0.5 | 163 |
| USAA Group | 0 | 2 |
| Progressive Group | 0.75 | 120 |
| Nationwide Corp Group | 0.28 | 25 |
| Liberty Mutual Group | 0.007 | 6 |
| Travelers Group | 0.009 | 2 |
| Southern Farm Bureau Casualty Group | 0 | 3 |
| Auto-Owners Group | 0.53 | 31 |
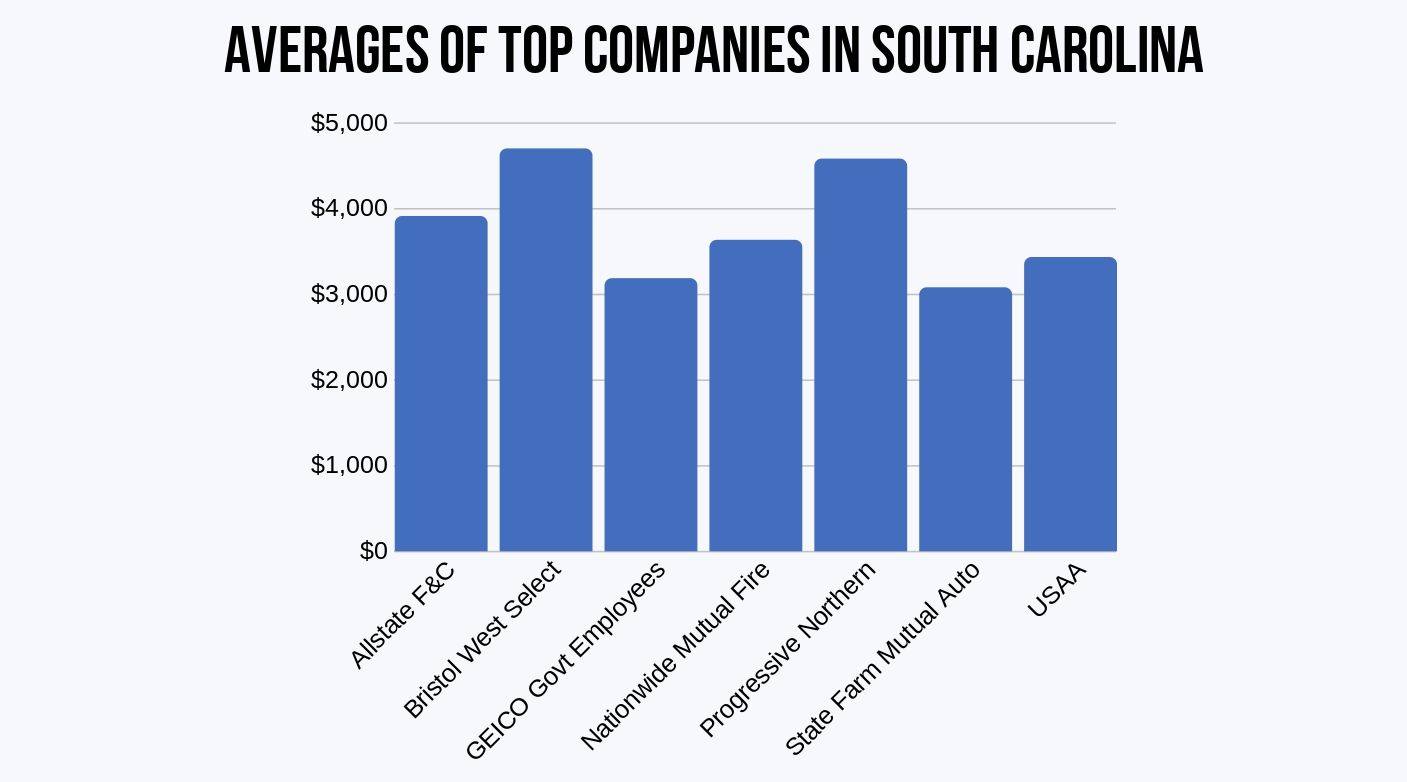
Cheapest Car Insurance in South Carolina
| Company | Average Annual Rate | Compared to State Average | Percentage Compared to State Average |
|---|---|---|---|
| Allstate F&C | $3,903.42 | $122.29 | 3.13% |
| Bristol West Select | $4,691.85 | $910.71 | 19.41% |
| Geico Govt Employees | $3,178.01 | -$603.13 | -18.98% |
| Nationwide Mutual Fire | $3,625.49 | -$155.65 | -4.29% |
| Progressive Northern | $4,573.08 | $791.94 | 17.32% |
| State Farm Mutual Auto | $3,071.34 | -$709.80 | -23.11% |
| USAA | $3,424.76 | -$356.37 | -10.41% |
If you take a look at how Bristol West Select compares to Geico, you can see that Geico costs 36% less. That’s almost $2,000 less than BWS! Yikes!
<!– –>
–>
Cost of Commutes by Traveler
For some people, how many miles they drive a day can affect their insurance rate. Buying car insurance by the mile can help.
| Company | Commute and Annual Mileage | Annual Average |
|---|---|---|
| Farmers | 10 miles commute. 6000 annual mileage. | $4,691.85 |
| Farmers | 25 miles commute. 12000 annual mileage. | $4,691.85 |
| Progressive | 10 miles commute. 6000 annual mileage. | $4,573.08 |
| Progressive | 25 miles commute. 12000 annual mileage. | $4,573.08 |
| Allstate | 25 miles commute. 12000 annual mileage. | $3,985.09 |
| Allstate | 10 miles commute. 6000 annual mileage. | $3,821.76 |
| Nationwide | 10 miles commute. 6000 annual mileage. | $3,625.49 |
| Nationwide | 25 miles commute. 12000 annual mileage. | $3,625.49 |
| USAA | 25 miles commute. 12000 annual mileage. | $3,460.97 |
| USAA | 10 miles commute. 6000 annual mileage. | $3,388.56 |
| Geico | 25 miles commute. 12000 annual mileage. | $3,195.12 |
| Geico | 10 miles commute. 6000 annual mileage. | $3,160.90 |
| State Farm | 25 miles commute. 12000 annual mileage. | $3,147.78 |
| State Farm | 10 miles commute. 6000 annual mileage. | $2,994.90 |
Most companies add around $100 more per year if you average 25 miles of driving a day. But, Allstate adds just under $200 to their yearly premium.
Still, commute times are among the smallest factors to affect your rates. Take a look.
Coverage Level Rates in South Carolina
Sometimes it can be tempting to go with a lower annual car insurance premium. But, a better plan with better insurance will protect you in case of an accident or natural disaster.
Look at the following table while you consider different coverage prices.
| Group | Coverage Type | Annual Average |
|---|---|---|
| Farmers | High | $5,200.86 |
| Progressive | High | $4,975.38 |
| Farmers | Medium | $4,688.90 |
| Progressive | Medium | $4,512.27 |
| Progressive | Low | $4,231.59 |
| Farmers | Low | $4,185.80 |
| Allstate | High | $4,147.71 |
| Allstate | Medium | $3,885.29 |
| Allstate | Low | $3,677.28 |
| Nationwide | High | $3,670.77 |
| Nationwide | Medium | $3,627.10 |
| USAA | High | $3,621.98 |
| Nationwide | Low | $3,578.60 |
| Geico | High | $3,426.18 |
| USAA | Medium | $3,419.89 |
| State Farm | High | $3,298.48 |
| USAA | Low | $3,232.43 |
| Geico | Medium | $3,146.50 |
| State Farm | Medium | $3,070.05 |
| Geico | Low | $2,961.35 |
| State Farm | Low | $2,845.49 |
By shopping around with different companies, you may be able to get better coverage for just a couple of bucks more every year. Take a look at Nationwide for example — the difference between their medium and high coverage rate is $43 a year! Read about Nationwide car insurance discounts for more information.
Credit History Rates
Can a good or bad credit history affect my car insurance rate? You betcha bottom dollar it can!
| Group | Credit History | Annual Average |
|---|---|---|
| Farmers | Poor | $5,381.84 |
| USAA | Poor | $5,347.18 |
| Progressive | Poor | $5,090.67 |
| Allstate | Poor | $4,904.52 |
| Geico | Poor | $4,847.10 |
| Farmers | Fair | $4,545.16 |
| Progressive | Fair | $4,464.31 |
| State Farm | Poor | $4,406.26 |
| Nationwide | Poor | $4,309.08 |
| Progressive | Good | $4,164.27 |
| Farmers | Good | $4,148.55 |
| Allstate | Fair | $3,692.64 |
| Nationwide | Fair | $3,496.39 |
| Allstate | Good | $3,113.11 |
| Nationwide | Good | $3,071.00 |
| State Farm | Fair | $2,691.12 |
| USAA | Fair | $2,628.01 |
| Geico | Fair | $2,607.11 |
| USAA | Good | $2,299.10 |
| State Farm | Good | $2,116.65 |
| Geico | Good | $2,079.82 |
If you have really bad credit, you are likely going to pay a few thousand dollars more a year for your car insurance premium. If you have great credit, generally you’ll pay less for car insurance. It’s that simple.
According to The Balance Magazine, the average credit score for South Carolina residents in 2017 was 657.
One other important factor that may impact your insurance rate even more than your credit score is your driving record.
Read more: Do all car insurance companies check your driving records?
Driving Record Rates
| Group | Driving Record | Annual Average |
|---|---|---|
| Progressive | With 1 accident | $5,451.21 |
| Farmers | With 1 accident | $5,418.24 |
| Farmers | With 1 speeding violation | $4,919.23 |
| Geico | With 1 DUI | $4,719.15 |
| Nationwide | With 1 DUI | $4,701.43 |
| Allstate | With 1 accident | $4,662.04 |
| USAA | With 1 DUI | $4,618.87 |
| Progressive | With 1 DUI | $4,555.95 |
| Progressive | With 1 speeding violation | $4,533.45 |
| Farmers | With 1 DUI | $4,508.61 |
| Allstate | With 1 DUI | $4,121.23 |
| Farmers | Clean record | $3,921.33 |
| Allstate | With 1 speeding violation | $3,887.64 |
| Progressive | Clean record | $3,751.71 |
| Nationwide | With 1 accident | $3,727.79 |
| State Farm | With 1 accident | $3,416.22 |
| USAA | With 1 accident | $3,341.10 |
| Nationwide | With 1 speeding violation | $3,180.84 |
| Geico | With 1 accident | $3,134.80 |
| State Farm | With 1 DUI | $3,039.99 |
| State Farm | With 1 speeding violation | $3,039.99 |
| USAA | With 1 speeding violation | $3,032.40 |
| Allstate | Clean record | $2,942.78 |
| Nationwide | Clean record | $2,891.90 |
| State Farm | Clean record | $2,789.17 |
| USAA | Clean record | $2,706.69 |
| Geico | Clean record | $2,429.04 |
| Geico | With 1 speeding violation | $2,429.04 |
As you can see, if you have had a DUI or even one speeding violation, your rates can dramatically increase. But if you’re a clean driver, your rates are likely to be on the lower end of the spectrum.
How Much Auto Insurance Costs in South Carolina
Discover the varying landscape of auto insurance expenses in South Carolina by examining rates in cities such as Anderson, Bluffton, Charleston, Florence, Hollywood, Pickens, Santee, and Wallace. This citywise comparison offers insights into the factors impacting car insurance rates, aiding you in making well-informed decisions for tailored coverage.
| Compare Car Insurance Rates in Your City | |
|---|---|
| Anderson, SC | Hollywood, SC |
| Bluffton, SC | Pickens, SC |
| Charleston, SC | Santee, SC |
| Florence, SC | Wallace, SC |
Number of Insurers in South Carolina
| Domestic | Foreign | Total Number of Licensed Insurers |
|---|---|---|
| 19 | 993 | 1012 |
What is the difference between licensed and foreign insurance?
South Carolina has its own set of laws that it abides by: these are called domestic laws. Domestic insurance is insurance that is created under South Carolina law.
Foreign insurance is created under the laws of any other state in America.
South Carolina State Laws
Have you ever been traveling through an unfamiliar state and gotten pulled over because you didn’t obey a traffic law? Usually, if you’re a good driver, you don’t disregard traffic laws on purpose. However, just because you’re unaware of the state laws doesn’t mean you’re going to get off with just a warning.
But what are some of the state driving laws in South Carolina?
Keep scrolling to learn more about South Carolina state laws.
Car Insurance Laws
We’ve already said that South Carolina requires every driver to have car insurance. According to the NAIC, regarding rate filings, filings under 7 percent are filed and used, and over 7 percent are prior approval. Regarding form filings, prior approval (60-day deemer).
File and use filings mean that rates must be filed with the state insurance department prior to their use. Prior approval filings are filings that must be filed and approved by the state insurance department before they can be used.
South Carolina state law requires everyone to have minimum liability coverage.
Fun fact:
There is no deductible for windshields for private passenger vehicles if you have comprehensive insurance. So the next time you’re driving down the road and a rock smashes into your windshield and it needs to be replaced, don’t worry — South Carolina state law says that you don’t have to pay to cover the cost of that cracked or broken windshield.
Read more: Does car insurance cover broken car windows?
Next, we will cover high-risk car insurance and what it means to have high-risk insurance.
High-Risk Insurance
No one wants to pay a higher car insurance premium, but sometimes, you can’t always get what you want.
https://www.youtube.com/watch?v=CySmd8M8oIM
You can’t always get what you want especially if you have been in a car accident.
South Carolina drivers who have been convicted of serious violations, such as a DUI, or who have had their licenses suspended may be required to file an SR-22 with their insurance.
Scan the list below for a few reasons that you might have to have high-risk insurance.
- Conviction of DUI/DWI
- Driving while uninsured
- A traffic violation that results in a fatality or serious injury
- A high number of points on your driving record
- A high-risk car (sports cars, etc.)
- Being over 70 years old
It doesn’t happen all the time, but if you are required to have high-risk insurance, some companies may not want to insure you. Read more about high-risk car insurance for more information.
Low-Cost Insurance
If you really, really want low-cost insurance, be a great driver. Avoid car accidents and don’t drink and drive. It’s pretty self-explanatory.
There are ways to lower your car insurance rate other than just being a great driver.
Here are just a few:
- Good student discount
- Anti-theft device discount
- Multi-car discount
- Homeowner’s discount
But wait! There are ways to save even more! Shopping around, comparing rates, and asking for a price match with other companies are all great ways to save.
Automobile Insurance Fraud in South Carolina
Insurance fraud by definition according to the Insurance Information Institute is a deliberate deception perpetrated against or by an insurance company or agent for the purpose of financial gain.
Just like every other state in America, insurance fraud is illegal in the state of South Carolina. Using a fake address for cheap car insurance is an example of insurance fraud.
Read more: Can you legally use a different address to get cheaper car insurance?
But how do you commit insurance fraud?
- Making a false claim
- Faking an accident
- Adding more damage to a legitimate claim
Still wondering what not to do when it comes to insurance fraud? Watch this short video about insurance fraud fails.
Insurance fraud in South Carolina is considered a felony and can be punishable by jail time.
Statute of Limitations
Statute of limitations means that there is a certain amount of time to file a charge against someone or something — or in this case, a claim. If you forget to file a claim or don’t file it within that statute of limitations, you will not receive money from your insurance company.
In South Carolina, a person has just three years to file a claim for property damage and/or personal injury.
Specific Driving Laws
Section 38-59-10 in the South Carolina code of laws says that when an insurer under an insurance policy requires written proof of loss after the notice of the loss has been given by the insured or beneficiary, the insurer or its representative shall furnish a blank to be used for that purpose.
If the forms are not furnished within 20 days after the receipt of the notice, the claimant is considered to have complied with the requirements of the policy as to proof of loss upon submitting within the time fixed in the policy for filing proofs of loss written proof covering the occurrence, character, and extent of the loss for which claim is made.
The 20-day period after notice of loss to furnish forms applies to all types of insurance unless a lesser time period is specifically provided by law.
Vehicle Licensing Laws
Since all drivers are required to have car insurance in South Carolina, there are serious penalties for driving without car insurance.
Penalties for Driving Without Insurance
| Offense | Penalty |
|---|---|
| 1st Offense | Fine: $100-$200 or 30-day imprisonment; failure to surrender registration and plates when insurance lapses; license/registration suspended until proof of insurance plus $200 reinstatement fee |
| Second Offense | Fine: $200 and/or 30-day imprisonment — within 10 years; license/registration suspended until proof of insurance plus $200 reinstatement fee |
As you can see, if you drive without insurance, you may end up in prison for 30 days without warning!
If you do have insurance, (and we hope you do by now) you need to provide proof of insurance at all times.
Some acceptable forms of proof of insurance are:
- Valid, current insurance card
- Copy of your car’s current insurance policy
- Valid insurance binder (this is a temporary form of insurance)
If you fail to surrender your registration and plates to a law enforcement officer and your insurance policy lapses, your license and registration will also be suspended until you show valid proof of insurance and pay a $200 reinstatement fee.
Teen Driver Laws
To get a learners license in South Carolina, you must be at least 15 years old. Take a look at the table below for more license requirements.
| Getting a License in SC | Requirements |
|---|---|
| Mandatory Holding Period | 6 Months |
| Minimum Supervised Driving Time | 40 hours, ten of those hours must be at night |
| Minimum Age | 15, 6 Months |
Finding young drivers car insurance requires comparing rates online as it can be difficult to find.
Teens in South Carolina with restricted licenses must also follow the requirements listed below.
| Restricted License Requirements in South Carolina | Time |
|---|---|
| Nighttime Restrictions | 6 p.m.-6 a.m. EST; 8 p.m.-6 a.m. EDT |
| Passenger restrictions (family members excepted unless noted otherwise) | no more than 2 passengers younger than 21 unless transporting students to and from school |
| Minimum Age at Which Restriction May be Lifted | Age |
| Nighttime Restrictions | 12 months and age 17 if intermediate license has been held for at least 6 months (min. age: 16, 6 mos.) |
| Passenger restrictions | 12 months and age 17 if intermediate license has been held for at least 6 months (min. age: 16, 6 mos.) |
Driver’s License Renewal Procedures
In South Carolina, it doesn’t matter if you’re 19 or 90 when you’re renewing your license — everyone young or old must renew their license every eight years and must show adequate proof of vision at the time of renewal.
South Carolina drivers are permitted to renew their license online or through the mail.
New Residents
If you want to drive that beautiful South Carolina shoreline and you just moved from another state to South Carolina, you have to get car South Carolina car insurance.
If you remember, South Carolina requires you to have the following minimum insurance coverage:
- $25,000 for bodily injury or death per person
- $50,000 for total bodily injury or death per accident
- $25,000 for property damage per accident
If you want to stay with the same car insurance company that you had in the state you moved from, you can absolutely do that — unless they won’t insure you in South Carolina.
Negligent Drivers
Reckless or negligent driving in South Carolina is defined as driving in a way that shows a willful or wanton disregard for the safety of persons or property. For a first violation, a motorist faces up to 30 days in jail or $25 to $200 in fines.
Reckless driving is a misdemeanor in South Carolina. The penalties for a conviction are:
- First offense. Motorists convicted of a first reckless driving offense face up to 30 days in jail or $25 to $200 in fines.
- Repeat offense. In addition to the first-offense penalties (see above), anyone convicted of a second or subsequent reckless driving offense within a five-year period is looking at a three-month license suspension.
A reckless driving conviction will also add six demerit points to a motorist’s driving record.
Don’t forget that a bad driving record will increase your car insurance rates.
South Carolina’s Rules of the Road
Just like we mentioned above, if you don’t know driving laws in the specific state you’re driving in, you are at risk of being pulled over and given a citation.
Keep reading to learn more about South Carolina’s rules of the road.
Fault vs. No Fault
South Carolina is an at-fault state. This means that when you cause an accident, you are the one who is responsible for covering the costs of damages and medical bills that result from that accident.
It is recommended that you purchase more than the minimum amount of insurance required as medical bills and car repair costs can add up very quickly.
You can also read about no-fault car insurance for more explanations on the difference between fault vs. no-fault insurance.
Seat Belt and Car Seat Laws
Don’t be a dummy and drive without a seat belt. It takes two seconds to pull that buckle across your chest and the reward for doing so could be saving your life.
| Seat Belt Laws in South Carolina | Details |
|---|---|
| Effective Since | July 1st, 1989 |
| Primary Enforcement | yes, effective December 9th, 2005 |
| Age/Seats Applicable | 8+ years in all seats |
| 1st Offense Max Fine | $25 |
South Carolina wants your child to be safe, so pay attention to these car sear laws and don’t put your child in harm’s way.
| Type of Car Seat Required | Age |
|---|---|
| Rear-Facing Child Restraint | Younger than 2 years in rear-facing child restraint until exceeding manufacturer height/weight limit |
| Forward-Facing Child Restraint | Children younger than 2 who outgrow rear-facing system and children 2 and older must be in forward-facing restraint with harness until exceeding manufacturer height/weight limit |
| Child Booster Seat | Children 4 and older who outgrow forward-facing child restraint must be in belt positioning booster using lap/shoulder belts until child is at least 8 years or at least 57 inches |
| Preference for Rear Seat | 7 years and younger must be in the rear seat if available |
| Adult Belt Permissible | 8 years or at least 57 inches tall if (1) lap belt fits across hips and thighs, not abdomen (2) shoulder belt crosses center of chest and not neck (3) knees bend over seat edge when sitting up straight with his/her back firmly against seat back |
Will insurance cover me if I am riding in the bed of a pick-up truck at the time of an accident?
Keep in mind that you will not be covered if:
- you are 15 or older
- you are 15 and younger when an adult is present
- your child is belted
- if you are riding during a parade
- if you are riding during an emergency situation
- for agricultural activities
- hunting
- if your vehicle was operated in your county at the time of the accident
- if your vehicle has a secured metal tailgate and operated at less than 36 mph at the time of accident
Keep Right and Move Over Laws
South Carolina state law says to keep right if you want to drive slower than the traffic around you. Basically, if you want to drive slow or you need to drive slow, just stay in the right lane.
The state law also says to reduce your speed and vacate the lane closest to stationary emergency vehicles.
These vehicles include but are not limited to:
- Tow trucks
- Recovery vehicles
- Ambulances
- Utility service vehicles
Remember to be cautious of workers on the side of the road and you should not have a problem following this law.
Speed Limits
Usually, if you’re going to get a ticket, it’s going to be a speeding ticket. Look at the box below to learn about South Carolina speed limit laws. Read about the best car insurance companies for people with speeding tickets for more information.
| Location | MPH |
|---|---|
| Rural Interstates | 70 mph |
| Urban Interstates | 70 mph |
| Other Limited Access Roads | 60 mph |
| Other Roads | 55 mph |
Ridesharing
If you are interested in getting a job driving for ridesharing companies like Uber or Lyft, you’ll need to have ridesharing insurance to protect you in case of an accident.
Geico is one car insurance company that provides ridesharing insurance.
Automation on the Road
Right now, there aren’t any laws against managing automated vehicles in the state of South Carolina.
Safety Laws
Every state has its own set of safety laws. Keep reading to find out what the safety laws are the South Carolina.
DUI Laws
In 2018, South Carolina was ranked 2nd in the nation for drunk driving fatalities. SafeWise reports that there were 7.98 drunk driving-related deaths per 100,000 people in 2018.
| DUI Offense | DUI Limit |
|---|---|
| Name for Offense | Driving under the influence (DUI) |
| BAC Limit | 0.08 |
| High BAC Limit | 0.16 |
| Criminal Status | 1st misdemeanor, 2nd in 10 years class C misdemeanor, 3rd in 10 years class A misdemeanor, 4th+ in 10 years class F felonies. |
| Look Back Period | 10 Years |
Because of this data, South Carolina has strict laws against drunk driving.
| DUI Penalties by Offense Number | License Revoked | Jail Time | Fine | Other |
|---|---|---|---|---|
| First Offense | 6 Months | 48 Hours - 30 Days | $400 minimum ($992 with assessments and surcharges) | – |
| Second Offense | 1 Year | 5 Days - 1 Year | $2,100-$5,100 ($10,744.50 with assessments and surcharges) | – |
| Third Offense | minimum 2 years. 4 years if within 5 years of 1st offense | 60 days - 3 years | $3800 - $6300 ($13,234.50 with assessments and surcharges) | if within 10 years of first offense, vehicle must be confiscated if offender is owner or resident of owner's house |
| Fourth Offense | permanent | 1-5 years | – | – |
Don’t drink and drive. Doing so could cost you your license, jail time, money, your own life, or someone else’s.
Marijuana-Impaired Driving Laws
Currently, there are no laws against doing marijuana while driving. However, that doesn’t mean you can’t be held responsible for driving under the influence of marijuana.
The state of South Carolina can charge you for impaired driving which could lead to fines, jail time, and more.
Distracted Driving Laws
Sometimes, texting or talking on your cell phone while driving can be worse than drunk driving. Be aware of whether you live in one of the most dangerous states for drunk driving.
While it’s not illegal to talk on the phone while driving, it is illegal to text while driving.
| Hand held ban | Young driver cell phone ban | Texting ban | Enforcement |
|---|---|---|---|
| No | No | All drivers | Primary |
What is primary enforcement?
If a police officer suspects that you are texting while driving, he or she has every right to pull you over.
South Carolina Can’t Miss Facts
We’ve covered state driving laws in depth, but now it’s time to jump into some of the most-known driving facts in South Carolina.
Similar to other states, South Carolina has unique driving risks. Knowing these risks will help keep you protected while driving along those gorgeous Carolina shorelines.
Up next we will cover everything you need to know about car theft, EMS response time, and more.
Vehicle Theft in South Carolina
Obviously, certain cars are more valuable than others, so some cars are more likely to be stolen than others.
If your car is stolen, your insurance may cover the cost of replacing it. Learning how cars are stolen is important to protect your vehicle from theft. Below is a list of the top 10 most stolen cars in South Carolina.
| Make/Model | Year | Thefts |
|---|---|---|
| Ford Pickup (Full Size) | 2006 | 586 |
| Honda Accord | 1996 | 458 |
| Chevrolet Pickup (Full Size) | 2004 | 455 |
| Ford Crown Victoria | 2003 | 210 |
| Toyota Camry | 2014 | 183 |
| Honda Civic | 2000 | 176 |
| Dodge Pickup (Full Size) | 2001 | 172 |
| Chevrolet Impala | 2008 | 166 |
| Nissan Altima | 2015 | 155 |
| Ford Explorer | 2002 | 146 |
Read more: Compare Honda vs. Ford Car Insurance Rates
According to this list, Ford pickups are the most stolen car in South Carolina.
But did you know that where you live can affect whether or not your car is at risk of being stolen?
Scan this list from the FBI to see how many thefts happened in your city in 2013.
| City | Larceny- theft | Motor vehicle theft |
|---|---|---|
| Abbeville | 135 | 8 |
| Aiken | 1,206 | 58 |
| Allendale | 64 | 7 |
| Anderson | 1,767 | 140 |
| Andrews | 134 | 8 |
| Aynor | 6 | 1 |
| Bamberg | 101 | 5 |
| Barnwell | 237 | 4 |
| Batesburg-Leesville | 200 | 13 |
| Beaufort | 659 | 19 |
| Belton | 152 | 21 |
| Bennettsville | 354 | 5 |
| Bishopville | 185 | 14 |
| Blacksburg | 79 | 4 |
| Blackville | 56 | 8 |
| Bluffton | 300 | 18 |
| Burnettown | 23 | 4 |
| Camden | 356 | 15 |
| Central | 141 | 9 |
| Chapin | 29 | 1 |
| Charleston | 2,725 | 162 |
| Cheraw | 305 | 11 |
| Chesnee | 39 | 1 |
| Chester | 262 | 12 |
| Chesterfield | 42 | 0 |
| Clemson | 303 | 50 |
| Clinton | 346 | 13 |
| Clover | 101 | 6 |
| Columbia | 5,800 | 791 |
| Conway | 727 | 42 |
| Cottageville | 9 | 1 |
| Coward | 11 | 1 |
| Cowpens | 44 | 4 |
| Darlington | 396 | 13 |
| Denmark | 108 | 13 |
| Dillon | 651 | 31 |
| Due West | 8 | 1 |
| Duncan | 66 | 5 |
| Easley | 1,066 | 60 |
| Edgefield | 31 | 4 |
| Edisto Beach | 58 | 1 |
| Ehrhardt | 23 | 0 |
| Elgin | 63 | 4 |
| Estill | 51 | 1 |
| Florence | 2,376 | 104 |
| Folly Beach | 114 | 7 |
| Forest Acres | 446 | 24 |
| Fort Lawn | 24 | 1 |
| Fort Mill | 170 | 2 |
| Fountain Inn | 108 | 9 |
| Gaffney | 275 | 27 |
| Gaston | 67 | 9 |
| Georgetown | 395 | 18 |
| Goose Creek | 724 | 49 |
| Great Falls | 87 | 5 |
| Greenville | 2,384 | 211 |
| Greenwood | 1,127 | 30 |
| Greer | 578 | 50 |
| Hampton | 104 | 6 |
| Hanahan | 342 | 30 |
| Hardeeville | 179 | 16 |
| Harleyville | 22 | 3 |
| Hartsville | 639 | 33 |
| Hemingway | 22 | 0 |
| Holly Hill | 95 | 12 |
| Honea Path | 95 | 8 |
| Inman | 50 | 2 |
| Irmo | 256 | 14 |
| Isle of Palms | 107 | 5 |
| Jackson | 19 | 2 |
| Johnsonville | 20 | 1 |
| Johnston | 44 | 5 |
| Kingstree | 224 | 16 |
| Lake City | 420 | 20 |
| Lake View | 35 | 0 |
| Lamar | 28 | 1 |
| Lancaster | 453 | 13 |
| Landrum | 49 | 2 |
| Latta | 76 | 5 |
| Laurens | 515 | 14 |
| Lexington | 624 | 13 |
| Liberty | 79 | 9 |
| Loris | 116 | 4 |
| Lyman | 126 | 0 |
| Lynchburg | 13 | 0 |
| Manning | 335 | 16 |
| Marion | 401 | 26 |
| Mauldin | 302 | 33 |
| McBee | 22 | 0 |
| McColl | 40 | 1 |
| McCormick | 52 | 7 |
| Moncks Corner | 415 | 35 |
| Mount Pleasant | 1,195 | 64 |
| Mullins | 252 | 10 |
| Myrtle Beach | 3,497 | 470 |
| Newberry | 401 | 8 |
| New Ellenton | 44 | 2 |
| Nichols | 9 | 0 |
| North | 24 | 0 |
| North Augusta | 701 | 26 |
| North Charleston | 4,409 | 503 |
| North Myrtle Beach | 1,153 | 136 |
| Orangeburg | 598 | 50 |
| Pacolet | 73 | 6 |
| Pageland | 133 | 9 |
| Pelion | 28 | 1 |
| Pickens | 163 | 14 |
| Port Royal | 207 | 13 |
| Prosperity | 20 | 0 |
| Ridgeland | 108 | 7 |
| Rock Hill | 2,066 | 121 |
| Salley | 1 | 2 |
| Saluda | 63 | 3 |
| Santee | 96 | 8 |
| Scranton | 14 | 0 |
| Seneca | 195 | 11 |
| Spartanburg | 2,060 | 118 |
| Springdale | 95 | 16 |
| St. George | 104 | 9 |
| St. Matthews | 51 | 9 |
| Sullivans Island | 47 | 1 |
| Summerton | 34 | 2 |
| Summerville | 1,239 | 87 |
| Sumter | 1,249 | 128 |
| Surfside Beach | 174 | 18 |
| Swansea | 32 | 3 |
| Tega Cay | 115 | 1 |
| Travelers Rest | 280 | 10 |
| Turbeville | 20 | 1 |
| Union | 272 | 6 |
| Wagener | 24 | 4 |
| Walhalla | 66 | 4 |
| Walterboro | 471 | 14 |
| Ware Shoals | 108 | 10 |
| Wellford | 17 | 5 |
| West Columbia | 625 | 40 |
| Westminster | 81 | 5 |
| West Pelzer | 106 | 7 |
| West Union | 34 | 2 |
| Whitmire | 37 | 1 |
| Williamston | 140 | 10 |
| Williston | 67 | 6 |
| Winnsboro | 181 | 6 |
| Woodruff | 74 | 5 |
| York | 280 | 11 |
Dangers on the Road in South Carolina
Now that we’ve discussed car theft, let’s move on to more dangers on the road in South Carolina.
In 2017, there were 988 traffic fatalities in South Carolina.
Some of those fatalities were caused by inclement weather.
| Weather Condition | Daylight | Dark, but Lighted | Dark | Dawn or Dusk | Other / Unknown | Total |
|---|---|---|---|---|---|---|
| Normal | 376 | 94 | 326 | 31 | 0 | 827 |
| Rain | 32 | 8 | 42 | 6 | 0 | 88 |
| Snow/Sleet | 1 | 0 | 0 | 0 | 0 | 1 |
| Other | 2 | 1 | 2 | 3 | 0 | 8 |
| Unknown | 0 | 0 | 0 | 0 | 0 | 0 |
| TOTAL | 411 | 103 | 370 | 40 | 0 | 924 |
Fatality Rates by County
| County | Fatalities 2013 | 2014 | 2015 | 2016 | 2017 | Fatalities per 100k Population 2013 | 2014 | 2015 | 2016 | 2017 |
|---|---|---|---|---|---|---|---|---|---|---|
| Abbeville County | 7 | 6 | 6 | 4 | 8 | 28.11 | 24.19 | 24.19 | 16.18 | 32.36 |
| Aiken County | 25 | 23 | 26 | 37 | 39 | 15.27 | 14.01 | 15.71 | 22.17 | 23.19 |
| Allendale County | 4 | 3 | 4 | 2 | 4 | 40.71 | 30.92 | 42.46 | 22.08 | 44.43 |
| Anderson County | 33 | 45 | 32 | 57 | 44 | 17.35 | 23.44 | 16.5 | 29.09 | 22.14 |
| Bamberg County | 4 | 2 | 4 | 7 | 4 | 25.95 | 13.18 | 27.19 | 48.18 | 27.81 |
| Barnwell County | 4 | 6 | 5 | 5 | 8 | 18.01 | 27.25 | 22.96 | 23.16 | 37.48 |
| Beaufort County | 13 | 23 | 17 | 30 | 26 | 7.6 | 13.13 | 9.45 | 16.35 | 13.92 |
| Berkeley County | 27 | 40 | 36 | 34 | 34 | 13.96 | 20.24 | 17.79 | 16.05 | 15.6 |
| Calhoun County | 7 | 12 | 10 | 10 | 7 | 46.7 | 80.86 | 67.76 | 67.79 | 47.61 |
| Charleston County | 44 | 47 | 64 | 54 | 71 | 11.83 | 12.37 | 16.44 | 13.62 | 17.69 |
| Cherokee County | 9 | 15 | 17 | 5 | 20 | 16.06 | 26.62 | 30.08 | 8.81 | 35.02 |
| Chester County | 10 | 9 | 17 | 18 | 15 | 30.56 | 27.76 | 52.49 | 55.76 | 46.44 |
| Chesterfield County | 12 | 3 | 16 | 9 | 12 | 26 | 6.5 | 34.64 | 19.49 | 26.12 |
| Clarendon County | 11 | 10 | 17 | 21 | 19 | 32.08 | 29.24 | 50.01 | 61.33 | 55.79 |
| Colleton County | 13 | 17 | 21 | 24 | 18 | 34.5 | 45.28 | 56.05 | 63.83 | 47.86 |
| Darlington County | 18 | 13 | 25 | 24 | 15 | 26.51 | 19.19 | 36.99 | 35.62 | 22.3 |
| Dillon County | 7 | 14 | 7 | 11 | 9 | 22.29 | 44.73 | 22.45 | 35.69 | 29.35 |
| Dorchester County | 17 | 16 | 32 | 32 | 17 | 11.64 | 10.72 | 20.86 | 20.85 | 10.87 |
| Edgefield County | 0 | 3 | 2 | 3 | 4 | 0 | 11.26 | 7.49 | 11.29 | 14.99 |
| Fairfield County | 8 | 8 | 7 | 10 | 13 | 34.49 | 34.74 | 30.6 | 44.19 | 57.5 |
| Florence County | 31 | 23 | 38 | 29 | 32 | 22.44 | 16.57 | 27.39 | 20.95 | 23.09 |
| Georgetown County | 13 | 7 | 18 | 6 | 15 | 21.54 | 11.53 | 29.36 | 9.78 | 24.35 |
| Greenville County | 71 | 62 | 73 | 87 | 74 | 15 | 12.87 | 14.87 | 17.43 | 14.6 |
| Greenwood County | 6 | 7 | 11 | 12 | 10 | 8.59 | 10.05 | 15.74 | 17.1 | 14.21 |
| Hampton County | 3 | 5 | 7 | 1 | 4 | 14.71 | 24.47 | 34.95 | 5.03 | 20.41 |
| Horry County | 55 | 58 | 81 | 70 | 67 | 19.03 | 19.47 | 26.2 | 21.78 | 20.1 |
| Jasper County | 8 | 15 | 15 | 25 | 11 | 30.27 | 56.05 | 54.34 | 89.06 | 38.65 |
| Kershaw County | 17 | 13 | 18 | 18 | 19 | 27.17 | 20.58 | 28.29 | 28.01 | 29.21 |
| Lancaster County | 5 | 16 | 15 | 14 | 18 | 6.2 | 19.18 | 17.39 | 15.58 | 19.45 |
| Laurens County | 11 | 24 | 22 | 21 | 29 | 16.62 | 36.1 | 33.12 | 31.55 | 43.38 |
| Lee County | 4 | 6 | 8 | 5 | 5 | 21.76 | 32.72 | 44.92 | 28.4 | 28.82 |
| Lexington County | 39 | 35 | 46 | 43 | 47 | 14.27 | 12.62 | 16.34 | 15.01 | 16.17 |
| Marion County | 8 | 9 | 11 | 9 | 8 | 24.93 | 28.18 | 34.65 | 28.34 | 25.56 |
| Marlboro County | 4 | 13 | 9 | 9 | 8 | 14.25 | 46.39 | 32.63 | 33.29 | 29.82 |
| Mccormick County | 1 | 4 | 3 | 4 | 4 | 10.12 | 40.76 | 31.05 | 41.8 | 41.91 |
| Newberry County | 7 | 4 | 7 | 6 | 7 | 18.68 | 10.61 | 18.5 | 15.77 | 18.19 |
| Oconee County | 3 | 13 | 13 | 11 | 18 | 4 | 17.29 | 17.15 | 14.4 | 23.29 |
| Orangeburg County | 34 | 28 | 31 | 30 | 28 | 37.51 | 31.11 | 34.79 | 33.96 | 32.01 |
| Pickens County | 14 | 13 | 16 | 19 | 20 | 11.75 | 10.8 | 13.19 | 15.45 | 16.2 |
| Richland County | 63 | 41 | 45 | 69 | 52 | 15.87 | 10.24 | 11.08 | 16.87 | 12.63 |
| Saluda County | 5 | 6 | 0 | 1 | 7 | 24.88 | 29.85 | 0 | 4.93 | 34.23 |
| Spartanburg County | 33 | 39 | 75 | 54 | 51 | 11.35 | 13.3 | 25.27 | 17.94 | 16.62 |
| Sumter County | 17 | 26 | 20 | 20 | 18 | 15.77 | 24.14 | 18.64 | 18.64 | 16.85 |
| Union County | 3 | 5 | 6 | 7 | 6 | 10.72 | 17.91 | 21.64 | 25.28 | 21.79 |
| Williamsburg County | 16 | 11 | 8 | 17 | 15 | 48.36 | 33.6 | 24.63 | 53.38 | 48.18 |
| York County | 23 | 25 | 18 | 36 | 28 | 9.64 | 10.22 | 7.18 | 13.95 | 10.51 |
Traffic Fatalities
Traffic fatality rates in rural areas are significantly higher than they are in urban areas.
| Traffic Fatalities (Rural Vs. Urban) | 2008 | 2009 | 2010 | 2011 | 2012 | 2013 | 2014 | 2015 | 2016 | 2017 |
|---|---|---|---|---|---|---|---|---|---|---|
| Rural | 878 | 878 | 611 | 694 | 748 | 614 | 570 | 555 | 613 | 687 |
| Urban | 43 | 16 | 198 | 134 | 115 | 153 | 253 | 424 | 407 | 301 |
Fatalities by Person Type
Road type may be a major cause of accidents, however, vehicle type can also be a major cause.
| South Carolina Fatalities by Person Type | Type of Vehicle | 2013 | 2014 | 2015 | 2016 | 2017 |
|---|---|---|---|---|---|---|
| Occupants | Passenger Car | 268 | 327 | 358 | 367 | 375 |
| – | Light Truck - Pickup | 110 | 118 | 105 | 118 | 116 |
| – | Light Truck - Utility | 94 | 106 | 121 | 118 | 133 |
| – | Light Truck - Van | 16 | 15 | 34 | 30 | 18 |
| – | Large Truck | 10 | 10 | 24 | 17 | 17 |
| – | Bus | 1 | 0 | 1 | 1 | 1 |
| – | Other/Unknown Occupants | 3 | 2 | 10 | 7 | 6 |
| – | Total Occupants | 502 | 579 | 653 | 661 | 668 |
| – | Light Truck - Other | 0 | 1 | 0 | 3 | 2 |
| Motorcyclists | Total Motorcyclists | 149 | 121 | 185 | 186 | 145 |
| Nonoccupants | Pedestrian | 100 | 107 | 123 | 144 | 154 |
| – | Bicyclist and Other Cyclist | 15 | 14 | 16 | 25 | 18 |
| – | Other/Unknown Nonoccupants | 1 | 2 | 2 | 4 | 3 |
| – | Total Nonoccupants | 116 | 123 | 141 | 173 | 175 |
| Total | Total | 767 | 823 | 979 | 1,020 | 988 |
Fatalities by Crash Type
If you check the list below, you’ll see that speeding results in many accidents, especially in accidents involving fatalities.
| Crash Type | 2013 | 2014 | 2015 | 2016 | 2017 |
|---|---|---|---|---|---|
| Total Fatalities (All Crashes)* | 767 | 823 | 979 | 1,020 | 988 |
| Single Vehicle | 476 | 503 | 527 | 575 | 569 |
| Involving a Large Truck | 64 | 63 | 114 | 104 | 90 |
| Involving Speeding | 305 | 307 | 366 | 393 | 416 |
| Involving a Rollover | 190 | 194 | 208 | 215 | 234 |
| Involving a Roadway Departure | 473 | 501 | 541 | 568 | 575 |
| Involving an Intersection (or Intersection Related) | 141 | 150 | 200 | 233 | 173 |
Five-Year Trend for the Top-10 Counties in South Carolina
Up next, we have a list of the top 10 counties in South Carolina with the most fatalities.
| 5 Year Trend For The Top 10 Counties of 2017 - Fatalities | 2013 | 2014 | 2015 | 2016 | 2017 |
|---|---|---|---|---|---|
| Greenville County | 71 | 62 | 73 | 87 | 74 |
| Charleston County | 44 | 47 | 64 | 54 | 71 |
| Horry County | 55 | 58 | 81 | 70 | 67 |
| Richland County | 63 | 41 | 45 | 69 | 52 |
| Spartanburg County | 33 | 39 | 75 | 54 | 51 |
| Lexington County | 39 | 35 | 46 | 43 | 47 |
| Anderson County | 33 | 45 | 32 | 57 | 44 |
| Aiken County | 25 | 23 | 26 | 37 | 39 |
| Berkeley County | 27 | 40 | 36 | 34 | 34 |
| Florence County | 31 | 23 | 38 | 29 | 32 |
Fatalities Involving Speeding by County
| County | Fatalities 2013 | 2014 | 2015 | 2016 | 2017 | Fatalities per 100k Population 2013 | 2014 | 2015 | 2016 | 2017 |
|---|---|---|---|---|---|---|---|---|---|---|
| Abbeville County | 4 | 1 | 2 | 4 | 6 | 16.06 | 4.03 | 8.06 | 16.18 | 24.27 |
| Aiken County | 9 | 7 | 7 | 20 | 20 | 5.5 | 4.26 | 4.23 | 11.98 | 11.89 |
| Allendale County | 2 | 1 | 1 | 0 | 0 | 20.35 | 10.31 | 10.62 | 0 | 0 |
| Anderson County | 10 | 15 | 13 | 21 | 17 | 5.26 | 7.81 | 6.7 | 10.72 | 8.55 |
| Bamberg County | 1 | 1 | 3 | 2 | 0 | 6.49 | 6.59 | 20.39 | 13.76 | 0 |
| Barnwell County | 1 | 4 | 3 | 2 | 3 | 4.5 | 18.16 | 13.78 | 9.26 | 14.05 |
| Beaufort County | 3 | 8 | 8 | 6 | 10 | 1.75 | 4.57 | 4.45 | 3.27 | 5.35 |
| Berkeley County | 11 | 16 | 12 | 15 | 15 | 5.69 | 8.1 | 5.93 | 7.08 | 6.88 |
| Calhoun County | 1 | 4 | 5 | 4 | 6 | 6.67 | 26.95 | 33.88 | 27.12 | 40.81 |
| Charleston County | 12 | 18 | 23 | 19 | 26 | 3.23 | 4.74 | 5.91 | 4.79 | 6.48 |
| Cherokee County | 4 | 9 | 7 | 3 | 7 | 7.14 | 15.97 | 12.39 | 5.29 | 12.26 |
| Chester County | 6 | 3 | 9 | 7 | 3 | 18.34 | 9.25 | 27.79 | 21.69 | 9.29 |
| Chesterfield County | 3 | 1 | 5 | 3 | 6 | 6.5 | 2.17 | 10.83 | 6.5 | 13.06 |
| Clarendon County | 4 | 6 | 7 | 10 | 12 | 11.66 | 17.54 | 20.59 | 29.21 | 35.24 |
| Colleton County | 5 | 7 | 6 | 7 | 7 | 13.27 | 18.64 | 16.01 | 18.62 | 18.61 |
| Darlington County | 11 | 9 | 10 | 13 | 8 | 16.2 | 13.29 | 14.8 | 19.3 | 11.89 |
| Dillon County | 2 | 10 | 4 | 6 | 7 | 6.37 | 31.95 | 12.83 | 19.47 | 22.83 |
| Dorchester County | 5 | 8 | 9 | 11 | 8 | 3.42 | 5.36 | 5.87 | 7.17 | 5.11 |
| Edgefield County | 0 | 1 | 0 | 2 | 4 | 0 | 3.75 | 0 | 7.52 | 14.99 |
| Fairfield County | 6 | 1 | 3 | 5 | 5 | 25.86 | 4.34 | 13.11 | 22.09 | 22.12 |
| Florence County | 11 | 6 | 21 | 12 | 13 | 7.96 | 4.32 | 15.14 | 8.67 | 9.38 |
| Georgetown County | 5 | 4 | 5 | 2 | 6 | 8.29 | 6.59 | 8.16 | 3.26 | 9.74 |
| Greenville County | 24 | 15 | 14 | 22 | 14 | 5.07 | 3.11 | 2.85 | 4.41 | 2.76 |
| Greenwood County | 5 | 4 | 5 | 5 | 4 | 7.16 | 5.74 | 7.15 | 7.13 | 5.69 |
| Hampton County | 3 | 1 | 2 | 0 | 1 | 14.71 | 4.89 | 9.98 | 0 | 5.1 |
| Horry County | 20 | 16 | 21 | 15 | 26 | 6.92 | 5.37 | 6.79 | 4.67 | 7.8 |
| Jasper County | 3 | 4 | 7 | 13 | 6 | 11.35 | 14.95 | 25.36 | 46.31 | 21.08 |
| Kershaw County | 9 | 4 | 9 | 7 | 7 | 14.38 | 6.33 | 14.15 | 10.89 | 10.76 |
| Lancaster County | 2 | 8 | 3 | 4 | 5 | 2.48 | 9.59 | 3.48 | 4.45 | 5.4 |
| Laurens County | 5 | 12 | 15 | 16 | 17 | 7.55 | 18.05 | 22.58 | 24.03 | 25.43 |
| Lee County | 1 | 0 | 3 | 3 | 3 | 5.44 | 0 | 16.84 | 17.04 | 17.29 |
| Lexington County | 18 | 10 | 13 | 14 | 16 | 6.59 | 3.6 | 4.62 | 4.89 | 5.51 |
| Marion County | 3 | 2 | 7 | 4 | 5 | 9.35 | 6.26 | 22.05 | 12.6 | 15.98 |
| Marlboro County | 1 | 7 | 6 | 3 | 6 | 3.56 | 24.98 | 21.76 | 11.1 | 22.37 |
| Mccormick County | 0 | 1 | 1 | 3 | 1 | 0 | 10.19 | 10.35 | 31.35 | 10.48 |
| Newberry County | 3 | 2 | 7 | 1 | 6 | 8 | 5.3 | 18.5 | 2.63 | 15.59 |
| Oconee County | 3 | 4 | 5 | 2 | 8 | 4 | 5.32 | 6.6 | 2.62 | 10.35 |
| Orangeburg County | 12 | 6 | 13 | 15 | 16 | 13.24 | 6.67 | 14.59 | 16.98 | 18.29 |
| Pickens County | 8 | 8 | 4 | 5 | 12 | 6.72 | 6.65 | 3.3 | 4.07 | 9.72 |
| Richland County | 26 | 18 | 14 | 29 | 23 | 6.55 | 4.49 | 3.45 | 7.09 | 5.59 |
| Saluda County | 0 | 2 | 0 | 1 | 2 | 0 | 9.95 | 0 | 4.93 | 9.78 |
| Spartanburg County | 10 | 16 | 35 | 15 | 21 | 3.44 | 5.46 | 11.79 | 4.98 | 6.84 |
| Sumter County | 9 | 10 | 5 | 9 | 9 | 8.35 | 9.28 | 4.66 | 8.39 | 8.42 |
| Union County | 1 | 5 | 5 | 7 | 4 | 3.57 | 17.91 | 18.03 | 25.28 | 14.53 |
| Williamsburg County | 10 | 4 | 3 | 10 | 6 | 30.22 | 12.22 | 9.24 | 31.4 | 19.27 |
| York County | 13 | 8 | 6 | 16 | 9 | 5.45 | 3.27 | 2.39 | 6.2 | 3.38 |
Fatalities in Crashes Involving an Alcohol-Impaired Driver
Alcohol-impaired drivers are another major cause of fatalities in crashes.
| Counties | Fatalities 2013 | 2014 | 2015 | 2016 | 2017 | Fatalities per 100k Population 2013 | 2014 | 2015 | 2016 | 2017 |
|---|---|---|---|---|---|---|---|---|---|---|
| Abbeville County | 3 | 2 | 2 | 1 | 0 | 12.05 | 8.06 | 8.06 | 4.05 | 0 |
| Aiken County | 14 | 9 | 10 | 13 | 8 | 8.55 | 5.48 | 6.04 | 7.79 | 4.76 |
| Allendale County | 2 | 1 | 0 | 0 | 1 | 20.35 | 10.31 | 0 | 0 | 11.11 |
| Anderson County | 13 | 19 | 8 | 14 | 20 | 6.83 | 9.9 | 4.13 | 7.14 | 10.06 |
| Bamberg County | 1 | 2 | 2 | 1 | 0 | 6.49 | 13.18 | 13.6 | 6.88 | 0 |
| Barnwell County | 0 | 1 | 4 | 3 | 4 | 0 | 4.54 | 18.37 | 13.89 | 18.74 |
| Beaufort County | 7 | 10 | 3 | 10 | 8 | 4.09 | 5.71 | 1.67 | 5.45 | 4.28 |
| Berkeley County | 13 | 14 | 10 | 12 | 11 | 6.72 | 7.08 | 4.94 | 5.66 | 5.05 |
| Calhoun County | 2 | 4 | 2 | 2 | 2 | 13.34 | 26.95 | 13.55 | 13.56 | 13.6 |
| Charleston County | 19 | 24 | 15 | 21 | 18 | 5.11 | 6.32 | 3.85 | 5.3 | 4.48 |
| Cherokee County | 3 | 6 | 4 | 1 | 7 | 5.35 | 10.65 | 7.08 | 1.76 | 12.26 |
| Chester County | 6 | 3 | 3 | 8 | 7 | 18.34 | 9.25 | 9.26 | 24.78 | 21.67 |
| Chesterfield County | 4 | 2 | 9 | 3 | 4 | 8.67 | 4.33 | 19.49 | 6.5 | 8.71 |
| Clarendon County | 5 | 3 | 6 | 6 | 5 | 14.58 | 8.77 | 17.65 | 17.52 | 14.68 |
| Colleton County | 3 | 7 | 10 | 8 | 6 | 7.96 | 18.64 | 26.69 | 21.28 | 15.95 |
| Darlington County | 10 | 3 | 10 | 9 | 4 | 14.73 | 4.43 | 14.8 | 13.36 | 5.95 |
| Dillon County | 2 | 6 | 2 | 5 | 2 | 6.37 | 19.17 | 6.41 | 16.22 | 6.52 |
| Dorchester County | 8 | 5 | 11 | 8 | 7 | 5.48 | 3.35 | 7.17 | 5.21 | 4.47 |
| Edgefield County | 0 | 2 | 0 | 1 | 0 | 0 | 7.5 | 0 | 3.76 | 0 |
| Fairfield County | 5 | 7 | 0 | 5 | 3 | 21.55 | 30.4 | 0 | 22.09 | 13.27 |
| Florence County | 9 | 11 | 10 | 11 | 15 | 6.51 | 7.93 | 7.21 | 7.95 | 10.83 |
| Georgetown County | 5 | 4 | 4 | 0 | 3 | 8.29 | 6.59 | 6.52 | 0 | 4.87 |
| Greenville County | 35 | 22 | 24 | 26 | 21 | 7.39 | 4.57 | 4.89 | 5.21 | 4.14 |
| Greenwood County | 2 | 4 | 6 | 3 | 5 | 2.86 | 5.74 | 8.58 | 4.28 | 7.11 |
| Hampton County | 2 | 2 | 2 | 0 | 0 | 9.81 | 9.79 | 9.98 | 0 | 0 |
| Horry County | 23 | 27 | 23 | 19 | 18 | 7.96 | 9.06 | 7.44 | 5.91 | 5.4 |
| Jasper County | 3 | 2 | 3 | 6 | 3 | 11.35 | 7.47 | 10.87 | 21.37 | 10.54 |
| Kershaw County | 12 | 5 | 5 | 8 | 6 | 19.18 | 7.92 | 7.86 | 12.45 | 9.23 |
| Lancaster County | 2 | 5 | 4 | 5 | 4 | 2.48 | 6 | 4.64 | 5.56 | 4.32 |
| Laurens County | 6 | 6 | 5 | 8 | 11 | 9.06 | 9.02 | 7.53 | 12.02 | 16.46 |
| Lee County | 3 | 1 | 6 | 3 | 3 | 16.32 | 5.45 | 33.69 | 17.04 | 17.29 |
| Lexington County | 21 | 16 | 22 | 20 | 21 | 7.68 | 5.77 | 7.81 | 6.98 | 7.23 |
| Marion County | 3 | 3 | 4 | 3 | 1 | 9.35 | 9.39 | 12.6 | 9.45 | 3.2 |
| Marlboro County | 1 | 4 | 1 | 1 | 1 | 3.56 | 14.27 | 3.63 | 3.7 | 3.73 |
| Mccormick County | 0 | 4 | 0 | 2 | 0 | 0 | 40.76 | 0 | 20.9 | 0 |
| Newberry County | 3 | 2 | 1 | 3 | 3 | 8 | 5.3 | 2.64 | 7.89 | 7.79 |
| Oconee County | 1 | 4 | 4 | 4 | 7 | 1.33 | 5.32 | 5.28 | 5.24 | 9.06 |
| Orangeburg County | 18 | 10 | 9 | 11 | 11 | 19.86 | 11.11 | 10.1 | 12.45 | 12.57 |
| Pickens County | 5 | 8 | 7 | 3 | 8 | 4.2 | 6.65 | 5.77 | 2.44 | 6.48 |
| Richland County | 28 | 18 | 16 | 24 | 16 | 7.05 | 4.49 | 3.94 | 5.87 | 3.89 |
| Saluda County | 1 | 3 | 0 | 1 | 1 | 4.98 | 14.93 | 0 | 4.93 | 4.89 |
| Spartanburg County | 11 | 19 | 24 | 17 | 14 | 3.78 | 6.48 | 8.09 | 5.65 | 4.56 |
| Sumter County | 10 | 12 | 4 | 10 | 6 | 9.28 | 11.14 | 3.73 | 9.32 | 5.62 |
| Union County | 0 | 1 | 4 | 1 | 2 | 0 | 3.58 | 14.42 | 3.61 | 7.26 |
| Williamsburg County | 7 | 3 | 2 | 11 | 4 | 21.16 | 9.16 | 6.16 | 34.54 | 12.85 |
| York County | 11 | 8 | 7 | 11 | 13 | 4.61 | 3.27 | 2.79 | 4.26 | 4.88 |
Teen Drinking and Driving
Teenage driving fatalities aren’t uncommon because inexperienced drivers tend to have accidents more often. But what is even more depressing is the number of teenage fatalities caused by drinking and driving.
| Number of Under 18 DWI Arrests: | Total Per One Million People (DUI Under 18 Arrests): | Rank: |
|---|---|---|
| 90 | 82 | 26 |
EMS Response Time
EMS response time can sometimes mean the difference between life and death.
| Time of Crash to EMS Notification | EMS Notification to EMS Arrival | EMS Arrival at Scene to Hospital Arrival | Time of Crash to Hospital Arrival | Total Fatal Crashes | |
|---|---|---|---|---|---|
| Rural | 8.04 min | 11.85 min | 29.38 min | 45.92 min | 559 |
| Urban | 6.78 min | 8.26 min | 24.42 min | 38.81 min | 382 |
It makes sense that there is a faster response time in urban areas compared to rural areas.
Transportation in South Carolina
Have you ever wondered how many cars your neighbors own?
The average number of cars owned in South Carolina per household is two.
Car Ownership
South Carolina’s car ownership average is illustrated in gray and the U.S. average is illustrated in orange.
Commute Time
Commuter Transportation
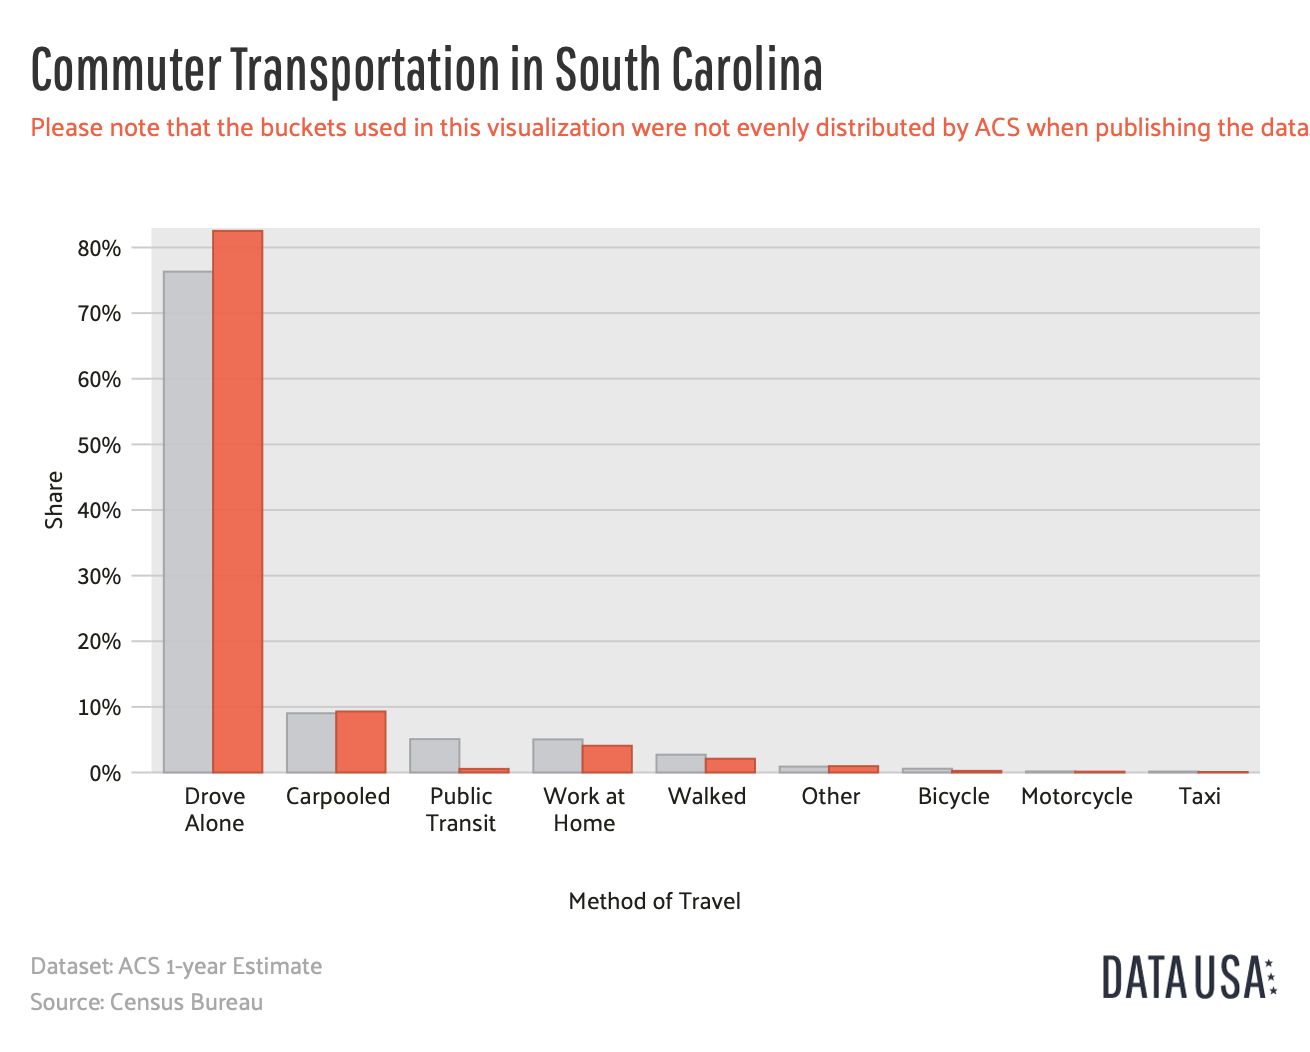
Worst Cities in South Carolina for Traffic Congestion
Charleston, South Carolina is one of the worst cities in the United States for traffic congestion.
| Congestion Level | Percentage |
|---|---|
| Morning Peak | 35% |
| Evening Peak | 59% |
| Highways | 16% |
| Non-highways | 30% |
| Average Extra Travel Time | 25% |
According to TomTom, you should give yourself an extra 29 minutes a day if you’re traveling to or from Charleston. At 29 minutes a day, that’s over 100 hours a year!
In this post, we’ve covered types of car insurance, car insurance rates, and South Carolina driving laws.
Now that you have all the information you need to purchase car insurance, you can start to compare South Carolina car insurance rates for yourself and your family and find the best plan out there to fit your specific needs.
Enter your zip code below to get started today!
Frequently Asked Questions
What is the best way to compare car insurance rates in South Carolina?
You can contact individual insurance companies directly and request quotes. Additionally, you can use online comparison tools, such as ours, that provide multiple quotes from different insurers. These tools typically require you to provide some personal information and details about your vehicle and driving history to generate accurate quotes.
What factors affect car insurance rates in South Carolina?
Common factors include your driving record, age, gender, marital status, type of vehicle you drive, your credit history, and the coverage options you choose. Additionally, factors like the location where you live in South Carolina and the frequency of car thefts and accidents in that area can impact insurance rates.
Are car insurance rates higher in South Carolina compared to other states?
Car insurance rates can vary from state to state, and South Carolina may have different rates compared to other states. Insurance companies consider factors like state regulations, population density, crime rates, and accident statistics when determining rates for a specific area.
Are there any discounts available for car insurance in South Carolina?
Yes, many insurance companies offer various discounts that can help you save on car insurance in South Carolina. Common discounts include safe driver discounts, multi-policy discounts (if you have multiple policies with the same insurer), good student discounts, low-mileage discounts, and discounts for having safety features installed in your vehicle.
Is it necessary to have full coverage car insurance in South Carolina?
Full coverage car insurance is not legally required in South Carolina. However, if you have a loan or lease on your vehicle, your lender or leasing company may require you to have comprehensive and collision coverage. Even if it’s not mandatory, having full coverage can provide added protection for your vehicle in case of accidents, theft, or other covered events.
What should I do if I can’t afford car insurance in South Carolina?
If you’re having difficulty affording car insurance in South Carolina, there are options you can explore. First, consider adjusting your coverage limits or deductibles to lower your premium. You can also reach out to insurance companies to inquire about any available discounts or payment plans that could make the insurance more affordable.
Additionally, some states offer low-cost or subsidized insurance programs for individuals with limited incomes. Contact your state’s insurance department or a local insurance agent to inquire about such programs in South Carolina.

Get a FREE Quote in Minutes
Insurance rates change constantly — we help you stay ahead by making it easy to compare top options and save.
![]() Secured with SHA-256 Encryption
Secured with SHA-256 Encryption